Volcanoes
How Volcanic Eruptions Are Predicted in Iceland
Learn how scientists monitor and predict volcanic eruptions in Iceland
Iceland is one of the most geologically active places in the world. It’s why Iceland is so unique and dynamic! That’s why, however, it’s important that scientists and government experts be able to effectively predict when and where a volcanic eruption might erupt.
But have you ever wondered how volcanologists can predict an eruption when everything seems invisible, happening underground until the moment lava bursts forth from the earth? Learn now about the data types used and challenges faced by natural hazard and scientific experts in Iceland to predict volcanic eruptions.
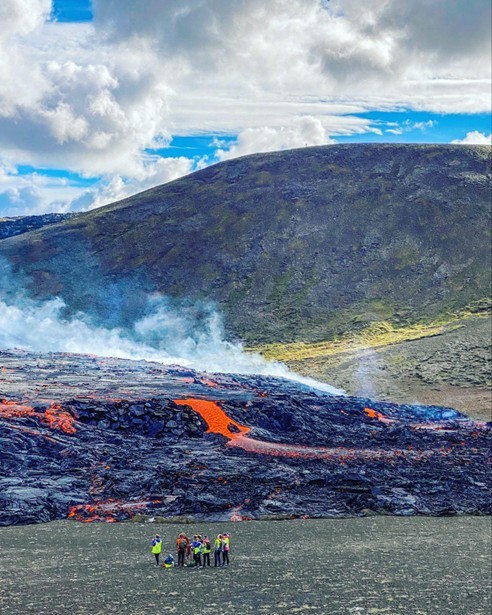
Volcanologists from the University of Iceland prepare to take lava measurements on the first day of the Meradalir eruption at Fagradalfjall volcanic system, Reykjanes, Iceland, August 2022. Photo by Jessiac Poteet.
How volcanoes in Iceland form
Before we can understand the types of data collected by scientists who monitor Icelandic volcanoes, we need to understand how these volcanic systems form (very generally speaking, of course!).
Knowing how they form helps us understand why scientists are collecting the data that they do. Here is the short breakdown of how many Icelandic volcanoes start their pre-eruption phase:
Magma moves upward from deep within the earth. With many Icelandic volcanoes, magma will start to accumulate underground for years or months before an eruption ever begins. This magma will break the existing bedrock as it moves upward and outward, from very deep within the earth’s crust or mantle boundary, and start to collect in the subsurface.
Magma starts to pool and collect. It will collect in different types of magma storage zones, like sills or magma chambers. These are different types of reservoirs underground that vary in size, shape, and how long they are in use.
Magma volume increases, and pressure increases. Pressure will begin to build up as the volume of magma underground increases and pushes against bedrock. The ground above the magma collection will begin to rise if enough magma is pooled.
Magma is injected into the shallow crust. When the pressure and volume reach a maximum (unique to each system), the magma breaks free and quickly moves to the surface through volcanic pipes or vents of pre-existing volcanoes or a network of dikes and fractures with newly formed volcanic fissures.
Magma erupts, turning into lava. The magma will break free of the ground and erupt into either (a) an explosive eruption of lava, ejecta, and ash, like Eyjafjallajökull, or (b) an effusive eruption of lava, like the current eruptions at Fagradalsfjall and Svartsengi.
So, why did we go over this process? Now you know the key geological steps and moments scientists and natural hazards experts are looking for as they predict what will happen next in the life of a volcano. They are looking for magma accumulation, ascension, and eruption.
Now that we understand the basic sequence of events leading to a volcanic eruption (again, very generally), we can go on to talk about the data!
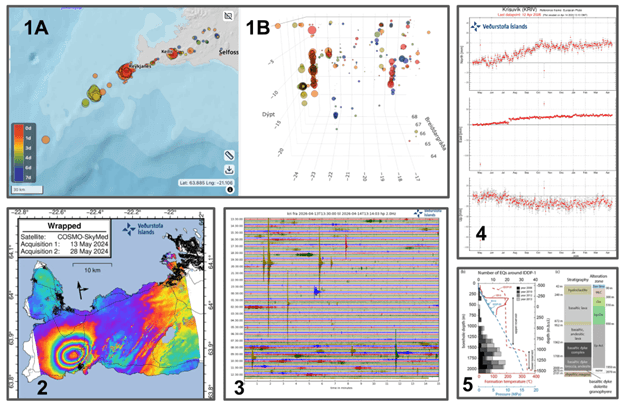
Examples of types of data scientists and natural hazards experts use to study and predict volcanoes: (1A&B) Earthquake data, but plotted on a map (1A) and then plotted in 3D space to show depth (1B); (2) A map made from two InSAR satellite passes over the Reykjanes peninsula, that shows uplift over the Svartsengi region; (3) another type of seismic (acoustic) data that shows the sound waves of earthquakes hitting a ground receiver; (4) GPS graphs of movement at Krýsuvík, showing movement in a north-south direction, east-west direction, and up-down direction; and (5) borehole data showing temperature, pressure, earthquakes, and lithology (i.e. rock types). Data from the Icelandic Meteorological Office (IMO) and the Journal of Geophysical Research, Krafla Geothermal field, 2026.
Data that experts use to predict volcanoes
There are lots of different types of data that volcanologists and natural hazard experts collect and study to help them predict an eruption, from deep within the earth to outer space. Let’s summarize these data types and discuss in-depth how they each help scientists. Here’s a quick synopsis:
Seismic data - monitors earthquakes caused by magma movement and tension or compression in the earth’s crust
GPS data - tracks real-time upwards, downwards, or lateral movements of the ground at a specific point.
InSAR data - uses satellites to measure long-term, high-resolution ground displacement of a large area
Borehole data - utilizes differences in temperature, tilt, pressure, chemistry, and fluid dynamics to monitor changes in the subsurface
Observational data - exploits our five sense to collect data on changes to the local environment
Analog data - brings in data from the past and from other similar volcanic systems to help draw parallels to current events
As you can see, there are a lot of data types scientists and natural hazard experts have at their disposal to study volcanic systems. Now, let’s go over each of these data types in more detail.
Seismic data
This acoustic data records vibrations in the Earth, allowing specialists to detect earthquakes and track how stress and magma move within a volcanic system. Patterns in these signals can reveal when magma is accumulating, rising, fracturing rock, or pressurizing the system. Seismic data usually comprises the magnitude of the quake, depth of the quake, the location on the surface directly above the quake. Using the statistics of many earthquakes over time, seismic specialists can begin to piece together a picture of movement and stress in the subsurface. For example, are all the earthquakes in an area localized at similar depths or are they all in a line at different depths? This could potentially be the difference between a sill or dike forming.
GPS data
Using both GPS and GNSS, which are fixed, ground-based receivers anchored to the land that use satellites to measure their position with millimeter precision. By tracking tiny shifts over time, scientists can detect ground deformation at a single point caused by magma moving beneath a volcanic system. Iceland’s satellite-based dataset tracks lateral movement, like north, south, east or west, but also y-axis movement, as in up or down. For example, movement upward could indicate that magma is accumulating in the subsurface, but movement downward could indicate magma is emptying from a magma chamber and moving elsewhere.
InSAR data
This stands for Interferometric Synthetic Aperture Radar (we promise there will not be a test on this!), and is an important type of satellite-gathered data that measures regional movement over a longer period of time. Very generally, a specific type of satellite will pass over a region, shooting radar over the land’s surface. If it is able to do this twice, on different dates, scientists are able to compare the two different passes of the satellite and produce a regional map of movement. The maps that are produced are very colorful, and complicated to read, but areas of broad color mean less movement and areas with tighter bands of color mean more movement or deformation of the ground.
Borehole data
if there are boreholes drilled in the area, sensors and monitors placed down the hole measure a whole host of data types, including temperature, tilt, pressure, gas chemistry, fluid dynamics, and even seismicity. Increases in temperature, changes in pressure, elevation in certain gases can be precursor warnings of magma movement. For example, in 2023, at the Svartsengi geothermal powerplant, increases in SO2 indicated that magma was ascending in the subsurface and getting closer to the depth of the borehole. And many of the volcano observation stations here have meters that measure the tilt of the ground.
Observational data
This is a wildcard dataset, and is not always a formal dataset. This is just human observations in local and regional changes that can alert us to a future volcanic eruption. Some of the biggest things natural hazard experts look out for in Iceland include glacial flooding as a volcanic system heats up, water supply warming as local wells register the increased heat, or intensified ground steaming or uptick in geothermal feature activity. This can also include going into the field and remotely conducting drone surveys, and making measurements of fresh fractures, fault scarps, and ground displacement.
Analog data
Scientists will use analog data from similar volcanic systems, either in Iceland or abroad, to form hypotheses about what their data mean and when the volcano might erupt compared to other similar volcanoes. This includes looking at all of the data above from other systems to see if there are parallels to be drawn between systems. For example, with Svartsengi, local experts are using the eruption timeline and subsurface data from the Krafla fires and Holuhraun to help estimate time between individual eruptions in the series of volcanic activity.
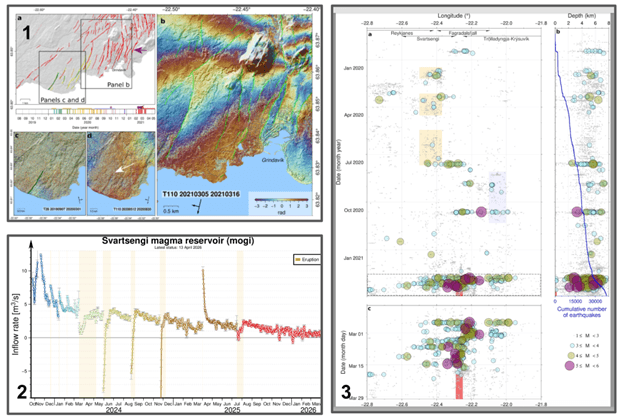
Examples of types of models and graphs scientists and natural hazard experts create from their data to predict volcanic eruptions: (1) a map of new fractures on Reykjanes Peninsula that were derived from field mapping in-person and InSAR data; (2) a model of the in-flow rate of magma into subsurface sill under Svartsengi; (3) earthquakes mapped by depth and time, with volcanic unrest (magma movement in the subsurface, but no eruptions) plotted. Data from the Bulletin of Volcanology and Nordic Volcanological Center at the University of Iceland, and from the Icelandic Meteorological Office.
How do scientists use this data to predict volcanoes?
After collecting this data, scientists then use all these data together to create a whole picture of a volcanic system and its current state. These are usually ever-green snapshots of a system, which evolve as magma collects, moves, and erupts. They can use much of this data to create a model of the subsurface to estimate magma volumes and fill rates of subsurface magma chambers or sills. These models can be 2D graphs of time versus volume or rate and surface maps, 3D drawings of the proposed subsurface magma collection, or 4D renderings of the magma accumulation over time.
Reliability of data in predicting volcano eruptions
Is this data reliable? For the most part, the data collected in volcano prediction is generally reliable. There are known circumstances that can affect the data integrity, however.
Precise triangulation of seismic data requires a dense network of sensors.
Bad weather (entirely too common in Iceland) and even active geomagnetic storms from the sun that cause aurora (also common in Iceland) can affect GPS data.
InSAR data can only work on land and if the region is snow- and cloud-free.
So there are many factors that can affect the data and its collection, although experts usually can account for these issues and make corrections.
Of course, while the data itself can be quite reliable overall, interpreting what it means can always prove challenging. Not every earthquake swarm is a precursor to an eruption, not every steamy lava field means magma is near the surface. There is no 100% prediction when it comes to volcanic eruptions, but scientists can usually pinpoint periods of time when an eruption is most likely to happen in the run-up to an eruption. And once magma gets shallow enough, scientists usually have 30 minutes to a few hours to warn the public of an impending eruption.
The final word on predicting volcanoes in Iceland
Hopefully, this gives you a new appreciation for the amount of data needed to be collected and interpreted by experts, and an understanding of how it is not a fool-proof, precise task to predict a volcanic eruption. It is hard to predict something we cannot see directly with our eyes. But, even though it is complex and challenging to predict a volcanic eruption, scientists in Iceland rise to the occasion every day!
Read more how Icelanders monitor and attempt volcanic activity
See real molten lava
At Lava Show, these concepts come to life in the most literal way, through a steaming, hot lava pour, engaging storytelling, and hands-on learning. Whether you’re a curious traveler or an aspiring scientist, understanding the language of volcanoes offers a deeper appreciation for the powerful natural forces shaping our world. At Lava Show you can experience real molten safelly flowing indoors in our locations in Reykjavik or Vík.
Discover the Lava Academy Podcast where you get in-depth conversation foscusing on the wonderful world of geology, volcanos and of course lava!
This article is written by geologist Jessica Poteet. Listen to the interview with her on the Lava Academy Podcast.